
On 30-31 January 2001, a panel of experts convened by The American Institute of Biological Sciences (AIBS) at the request of USAMRMC reviewed the AHAAH model as a basis for a new standard for rating the hazard from impulse noise. In the final analysis, the AIBS panel asserted that the AHAAH model would make a superior replacement for the present military standard.
USAMRMC later requested that JAYCOR review the issues associated with the establishment of a new standard and they argued in a meeting at USAMRMC on 4 Jan 2002, that the procedure used by ARL in analyzing the Albuquerque dataset was statistically flawed and as a result, the true hazard in the dataset was significantly underestimated. If true, it would follow that the AIBS panel’s recommendation that AHAAH be used as the basis for a noise standard for the Army should be reconsidered. The present paper examines these contentions and will show that the arguments advanced in the JAYCOR report are based on unsupportable assumptions and in any event should have no effect on the AIBS panel’s findings. Further, ARL’s assessment of the Albuquerque dataset remains accurate.
Specifically this paper shows that (1) the analytical approach suggested by JAYCOR contains serious flaws, based on an unsupportable assumption regarding the impulse exposures used in the studies and (2) the analysis and assumptions that ARL used in the presentation to AIBS were clearly documented, technically justified, and the issue(s) described clearly to and understood by the panel at the time of their review in January 2001. Even if the alternate analytical procedure recommended by JAYCOR were followed, however, the evaluation of the accuracy of the AHAAH model’s predictions is essentially unchanged. In the end, the AHAAH model remains by far the most accurate and rigorous method of assessing impulse noise hazard.
Beyond that, because of its foundation in auditory theory (rather than in correlational analysis), the AHAAH model also has the advantage of unambiguously rating hazard from all impulses, including datasets for unprotected exposure to rifles and spark gaps, not just those from the MRMC data set. Its theoretical base also means that it has the highest probability of correctly rating hazards from sounds not in the immediate data set on which it has been validated.
Analysis of the Conventions
In their analysis of the Albuquerque data, JAYCOR made the argument that for any given type of impulse (in the data sets referred to as 1M, 3M, and 5M), hazard should be expected to rise as a function of increasing peak pressure. If that is true, then they also argued that a subject getting an excessive threshold shift following a given exposure (25 dB or greater at any frequency) should be presumed to have failed at all higher peak pressures or numbers of impulses. Put another way, there should be a monotonic relationship between peak pressure in the incident sound field and hazard. They point out that this expectation was held by the designers of the Albuquerque studies and has traditionally been held by independent statistical experts. Because ARL’s analysis of the threshold shift data for the AIBS panel did not propagate failures upward, JAYCOR argued that the true hazard was underrepresented and fourof the exposures rated as safe by ARL should have been rated (marginally) hazardous.
There is a basic plausibility to this argument; however, it is based on at least two critical assumptions: (1) that the hearing protectors worn by the subjects were consistent from dataset to dataset and linear in their effects with respect to amplitude and (2) that as they arrive at the ear, the impulses within a data set differ in no important way (other than in peak level). Neither of these assumptions is supported by the data with the result that traditional expectations just don’t apply.
Figure 1. Analysis of the 1-meter exposure under the muff for the 50 percentile ear. (The change in ADUs as a function of peak pressure in the free field is plotted as is the change in A-weighted energy under the muff. The line representing a linear relationship between energy in the free field and energy under the muff is also plotted as is the energy present under the muff.)
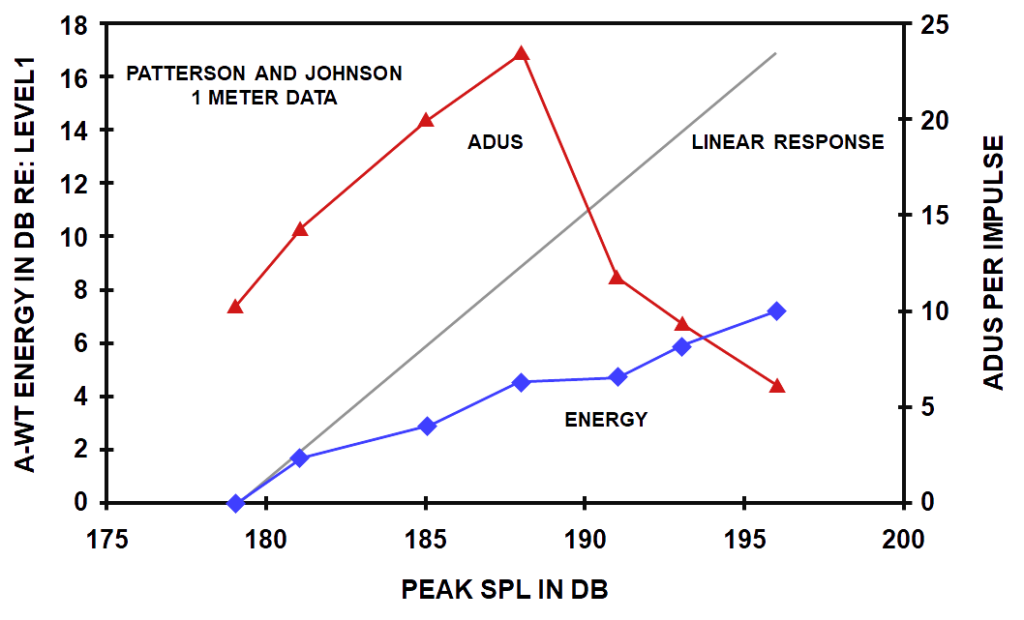
In addition, when JAYCOR ran the impulses for the 1M and 3M exposures through the AHAAH model, they found (correctly) that the calculated hazard did not increase monotonically with peak pressure in the free field. This point is illustrated in Figure 1, which presents the model’s analysis of the 1M dataset. The ADUs for individual impulses in that dataset rose to a peak at level four (188 dB) and then declined as the level rose farther. A roughly similar but much less dramatic pattern was also present in the 3M dataset (but not in the 5M datasets). This pattern of response was indeed counter to traditional expectations and was held by JAYCOR to be evidence of erratic behavior of the AHAAH model. However, a careful analysis of the pressure histories and the implications for stimulation of the inner ear led to the conclusion that this pattern of response makes good theoretical sense, even if it is not “traditional”. We note in passing that an appeal to the “traditional” is misdirected. The heart of the impulse noise problem is that traditional methods of analysis that focus on the acoustic waveforms while ignoring the physiology of the ear have simply failed to rate hazard correctly. Thus, the need for a non-traditional theoretically based analytical approach such as the AHAAH model.
The inversion in the growth of the ADU curve in Figure 1 is indeed counter to traditional expectations and produces an unavoidable conflict of approaches to hazard evaluation in the Albuquerque dataset. If we suppose traditional thinking to be correct, a subject getting excess TS at a lower level peak pressure would also be expected to fail at higher levels and greater numbers of impulses. Such a subject should not be exposed to higher levels of stimulation. This in fact was the premise behind the design of the Albuquerque studies and determined the exposure pattern of the subjects. Therefore, to be consistent with this premise, the failure analysis of the dataset should assume failures at higher levels.
Suppose however, that traditional thinking is not correct. If the hazard is truly less at higher peak pressures, as Figure 1 argues, then it would be incorrect to require that failures at lower levels be scored as failures at higher levels. Such a procedure would over-represent the true hazard. Both under- and over-representation should be avoided because there are real risks associated with each type of error.
How might this impasse be resolved? Careful examination of the waveforms reveals that there is a basis for making a decision. Implicit in the basic argument regarding the upward propagation of failures is the assumption that as peak pressures rose (charge size increased), the waveforms were all essentially similar, i.e. all impulses in the 1 M or 3M or 5 M conditions differed in no significant way (other than increasing peak pressure). The method of analysis promoted by JAYCOR (Chan et al., 2001), for example, pays primary attention to just the peak pressure in the incident waveform (outside the protector). The difficulty with this approach is that the waveforms that actually acted on the ear, the impulses arriving at the ear canal entrance, differed in important ways at different pressures in the 1M and 3M conditions.
In contrast to the traditional methods of analysis, the AHAAH model examines all the information in the waveform in its calculation and provides insight into the action of the stimuli. When the impulses under the muff were analyzed with the model, it became apparent that shape of the impulses in both the 1M and 3M conditions changed materially as the pressure rose. The effect of these changes, brought about by the non-linear hearing protector1 and the peak-clipping non-linearity in middle ear, was to reduce the stimulating efficiency of the higher level impulses so that they would be expected to be less hazardous than the lower level impulses. These effects are illustrated for the 1M impulses in detail in Appendix A. The inversion of stimulating effectiveness is a function of peculiarities in this particular dataset and results from the interaction of the dynamics of the defeated muff with pressure histories of the impulses and the non-linearities in the middle ear. Such effects can occur in other situations but would probably not be characteristic of impulses and muffs in general. It is clearly the case in this particular dataset.
Given the reality of these changes in impulse shape and the model’s indication that the stimulating efficiency of the impulse was in fact lower, it would be inconsistent with the application of the model to assert that failure at level 4, for example, would also imply failure at levels where the model says the exposure is less hazardous.
These anomalies in the data set were explained at the time of the AIBS review to the reviewing panel (15 slides were devoted to this point) and in the analysis of test results, failures at lower levels were not propagated upward. (However, at level 6 where exposures also consisted in increasing numbers of impulses at the same level [and the same pulse shape] it was consistent with the model’s interpretation to presume that failure at a lower number of impulses should be presumed to also be a failure for a higher number of impulses).
Given the nature of the experimental design in the Albuquerque studies, it is not possible to have one analytical approach that is free of all possible objections. The approach used by ARL in presenting the data to the AIBS review panel avoided making unsupported assumptions about the data, was consistent with the significant change in the impulse shape and was also consistent with a uniform application of the model.
Suppose, for a moment however, that the suppositions made by JAYCOR were in fact correct (that peak pressure and hazard are monotonically related). If we accept their analytical approach, ARL’s analysis may have missed true failures and as a result, under-represented the true hazard present in the Albuquerque dataset. So in the interests of fair play and as a test, we re-analyzed the Albuquerque dataset using the procedure commended by JAYCOR. In this case, all failures were propagated to higher levels and numbers of impulses. Then AHAAH’s predictions were compared with the analysis of losses.
The results from the AHAAH recommended procedure appear in Tables I through III and the results from the JAYCOR procedure appear in Tables IV though VI. As expected, there appear to be somewhat more losses when the JAYCOR procedure is used, especially in the 1M and 3M conditions.
Table I: AHAAH Analysis of 1 Meter Exposure Data
Data analyzed with AHAAH criterion for failure.
| Level | Impulses | Impulses | Impulses | Impulses | Impulses |
|---|---|---|---|---|---|
| 6 | 12 | 25 | 50 | 100 | |
| 7 | 56\2 | HAZARD | HAZARD | HAZARD | |
| 6 | 59\0 | 56\2 | HAZARD 56\4 | HAZARD 49\7 | HAZARD 37\11 |
| 5 | 63\1 | HAZARD | HAZARD | HAZARD | HAZARD 19\10 |
| 4 | 63\0 | HAZARD | HAZARD | HAZARD | HAZARD |
| 3 | 64\1 | HAZARD | HAZARD | HAZARD | HAZARD |
| 2 | 65\0 | HAZARD | HAZARD | HAZARD | HAZARD |
| 1 | 65\0 | HAZARD | HAZARD | HAZARD |
Table II: AHAAH Analysis of 3 Meter Exposure Data
Data analyzed with AHAAH criterion for failure.
| Level | Impulses | Impulses | Impulses | Impulses | Impulses |
|---|---|---|---|---|---|
| 6 | 12 | 25 | 50 | 100 | |
| 7 | 41\10 | HAZARD | HAZARD | HAZARD | |
| 6 | 65\3 | 62\4 | HAZARD 59\6 | HAZARD 58\10 | HAZARD 37\12 |
| 5 | 68\2 | HAZARD | HAZARD | HAZARD 22\4 | |
| 4 | 68\0 | HAZARD | HAZARD | HAZARD | |
| 3 | 68\0 | HAZARD | HAZARD | HAZARD | |
| 2 | 68\0 | HAZARD | HAZARD | HAZARD | |
| 1 | 68\0 | HAZARD | HAZARD | HAZARD |
Table III: AHAAH Analysis of 5 Meter Exposure Data
Data analyzed with AHAAH criterion for failure.
| Level | Impulses | Impulses | Impulses | Impulses | Impulses |
|---|---|---|---|---|---|
| 6 | 12 | 25 | 50 | 100 | |
| 7 | 55\1 | HAZARD | HAZARD | HAZARD | |
| 6 | 57\0 | 57\1 | HAZARD 57\1 | HAZARD 57\1 | HAZARD 56\2 |
| 5 | 57\0 | HAZARD | HAZARD | HAZARD | |
| 4 | 58\0 | HAZARD | HAZARD | HAZARD | |
| 3 | 59\0 | HAZARD | HAZARD | HAZARD | |
| 2 | 59\0 | HAZARD | HAZARD | ||
| 1 | 59\0 | HAZARD | HAZARD |
Table IV: JAYCOR Analysis of 1 Meter Exposure Data
Data analyzed with JAYCOR criterion for failure.
| Level | Impulses | Impulses | Impulses | Impulses | Impulses |
|---|---|---|---|---|---|
| 6 | 12 | 25 | 50 | 100 | |
| 7 | 58\4 | HAZARD | HAZARD | HAZARD | |
| 6 | 61\2 | 60\6 | HAZARD 60\8 | HAZARD 53\11 | HAZARD 41\15 |
| 5 | 64\2 | HAZARD | HAZARD | HAZARD | HAZARD |
| 4 | 64\1 | HAZARD | HAZARD | HAZARD | HAZARD |
| 3 | 64\1 | HAZARD | HAZARD | HAZARD | HAZARD |
| 2 | 65\0 | HAZARD | HAZARD | HAZARD | HAZARD |
| 1 | 65\0 | HAZARD | HAZARD | HAZARD |
Table V: JAYCOR Analysis of 3 Meter Exposure Data
Data analyzed with JAYCOR criterion for failure.
| Level | Impulses | Impulses | Impulses | Impulses | Impulses |
|---|---|---|---|---|---|
| 6 | 12 | 25 | 50 | 100 | |
| 7 | 44\3 | HAZARD | HAZARD | HAZARD | |
| 6 | 67\5 | 64\6 | HAZARD 61\8 | HAZARD 60\12 | HAZARD 39\14 |
| 5 | 68\2 | HAZARD | HAZARD | HAZARD 23\5 | |
| 4 | 68\0 | HAZARD | HAZARD | HAZARD | |
| 3 | 68\0 | HAZARD | HAZARD | HAZARD | |
| 2 | 68\0 | HAZARD | HAZARD | HAZARD | |
| 1 | 68\0 | HAZARD | HAZARD | HAZARD |
Table VI: AHAAH Analysis of 5 Meter Exposure Data for Modified Muff
Data analyzed with AHAAH criterion for failure.
| Level | Impulses | Impulses | Impulses | Impulses | Impulses |
|---|---|---|---|---|---|
| 6 | 12 | 25 | 50 | 100 | |
| 7 | 55\1 | HAZARD | HAZARD | HAZARD | |
| 6 | 57\0 | 57\1 | HAZARD 57\1 | HAZARD 57\1 | HAZARD 56\2 |
| 5 | 58\0 | HAZARD | HAZARD | HAZARD 23\5 | |
| 4 | 59\0 | HAZARD | HAZARD | HAZARD | |
| 3 | 59\0 | HAZARD | HAZARD | HAZARD | |
| 2 | 59\0 | HAZARD | HAZARD | ||
| 1 | 59\0 | HAZARD | HAZARD |
However, the accuracy of the model found to be essentially the same when both methods of rating hazard when the test of failure2 developed by Johnson and Patterson et al. (1990; 1994) is applied. The reason for this is that the difference in the analytical procedures was within the statistical uncertainty associated with the data set. In other words, JAYCOR, in saying that four cases had been underrated in hazard had identified those exposures with between 5% and 10% losses, and asserted that any data with more than 5% loss was statistically “true.” However, in order to be 95% certain that the loss was “real” it would have been necessary to have had more than 10% losses (N>6). In the tables the “HAZ” entry indicates that the AHAAH model predicted the cell to be hazardous (>500 ADUs). For all entries in these tables no cell predicted to be safe contained more than 6 TSs and all cells predicted to be hazardous contained at least one TS. For these data the model predicted correctly in all cells for both sets of tables. We can conclude that the distinction made in the JAYCOR analysis that formed the basis for the Jan 4th comments makes no significant difference in the estimate of the model’s accuracy.
Conclusions
We conclude that the issue raised in the JAYCOR analysis was based on flawed assumptions but even if the premises were granted, it would be a distinction without a difference. The accuracy of the AHAAH model remains essentially as it was presented to the AIBS panel.
Furthermore, the other immense advantages of the AHAAH model remain intact. Because of its theoretical base and the fact that it was not developed using the Albuquerque data set, it can be expected to generalize to new and untested datasets with confidence. The model’s overall accuracy (better than 95% correct assessments for all impulses tested) is still unmatched by any other assessment technique (A-weighted energy and MIL-STD 1474 being accurate less than 40% of the time3). The strong endorsement of the AHAAH model by the AIBS review panel remains unaffected.
Footnotes
1 The non-linearity of the protector is portrayed in Fig. 1. Note that the line marked “energy”; (under the muff) rises only about 7 dB rather than 18 dB as would be expected (the line marked “linear”). This results from the fact that the muff became non-linear with respect to amplitude and at the highest pressure attenuates 11 dB better than we would expect from a linear protector.
2 Following the procedure developed by MRMC to ensure that the response of the 95 percentile ear had been identified with 95% certainty, if the hazard-rating system made a prediction that an exposure was hazardous and less than 1 subject (for an N=60) showed an unacceptable TS, then it was an over-prediction of hazard. If, on the other hand, the prediction was that the exposure was safe and more than 6 Ss showed excess TS, then it was an under-prediction. Put another way, the prediction that a particular exposure was hazardous was scored as correct if between 1 and 6 subjects showed a TS.
3 Chan et al (2001) did publish an analysis of the Albuquerque dataset using logistic regression analysis and achieved a good fit to the loss data.. However, Price (2002) has pointed out that the sizable and varying non-linearities of the hearing protector used in the Albuquerque studies have made the dataset unique. As a result, the analysis by Chan et al. (which was based on peak pressure in the incident field and took no specific account of the protectors) may have produced a good fit to this particular dataset but it has essentially no meaning outside it and should not be used as a basis for any recommendation regarding hazard from other impulses and other protective devices.
References
- Chan, P. C., Ho, K. C., Kan, K.K., Stuhmiller, J. H. and Mayorga, M. M. (2001); “Evaluation of impulse noise critieria using human volunteer data”, J. Acoust. Soc. Am. 110, 1967-1975.
- Johnson, D. L., Patterson, J. D., Nelson, W. R., Ripple, G, Mundie, T. G., Christensen, W. I. And Bova, C. M. (1990). “Direct determination of occupational exposure limits for freefield impulse noise”, Vol. III of III Appendices,; Protocol for study, US Army Med R&D Command.
- Patterson, J. J. Jr. and Johnson, D. L. (1994). “Temporary threshold shifts produced by high intensity freefield impulse noise in humans wearing hearing protection”, USAARL Rept. No. 94-46, U. S. Army Aeromedical Research Laboratory, Ft. Rucker, AL 36362-0577.
- Price, G. R. (2002) “The uniqueness of the Albuquerque data set and Evaluation of impulse noise criteria using human volunteer data” [J. Acoust. Soc. Am 110, 1967-1975 (2001)] by Chan et al., submitted to the Journal of the Acoustical Society of America; in review.